Z-Score Volume with CVD ConfirmationZ-Score Volume with CVD Confirmation is a volume-based confluence tool that enhances traditional volume analysis by combining Z-Score volume anomalies with Cumulative Volume Delta (CVD) confirmation. This indicator helps traders identify unusual volume activity that aligns with directional order flow, offering a cleaner signal for potential breakout or reversal scenarios.
🔍 Key Features:
Z-Score Calculation: Measures how extreme current volume is relative to its recent average, highlighting statistically significant surges or drops.
CVD Confirmation: Uses Cumulative Volume Delta candles (open/high/low/close) to assess buying vs. selling pressure in lower timeframes.
Bar Color Logic:
Green: High Z-Score volume confirmed by CVD bullish candle
Red: High Z-Score volume confirmed by CVD bearish candle
Other color bands show progressively strong or weak volume outliers
Real Volume Bar Heights: Volume bars retain true scale while color reflects underlying order flow strength and direction.
💡 Use Cases:
Breakout validation: Confirm price range breaks when volume surge is supported by CVD direction
Fade setups: Detect unsustainable high-volume moves lacking CVD support
Trend continuation: Spot momentum when both Z-Score and CVD align in the direction of the trend
⚙️ How to Use:
Adjust the Z-Score length to define how far back to measure average and deviation.
Select your anchor timeframe (typically 1D) and a lower timeframe for CVD calculations (e.g., 1-minute).
Use color-coded volume bars to assess volume significance and directional flow at a glance.
Add the standard volume indicator to the chart so one can compare the difference between the standard volume indicator and the Z-Score Volume with CVD Confirmation script. Useful at specific price levels and exiting ranges or not.
Search in scripts for "VOLUME BAR"

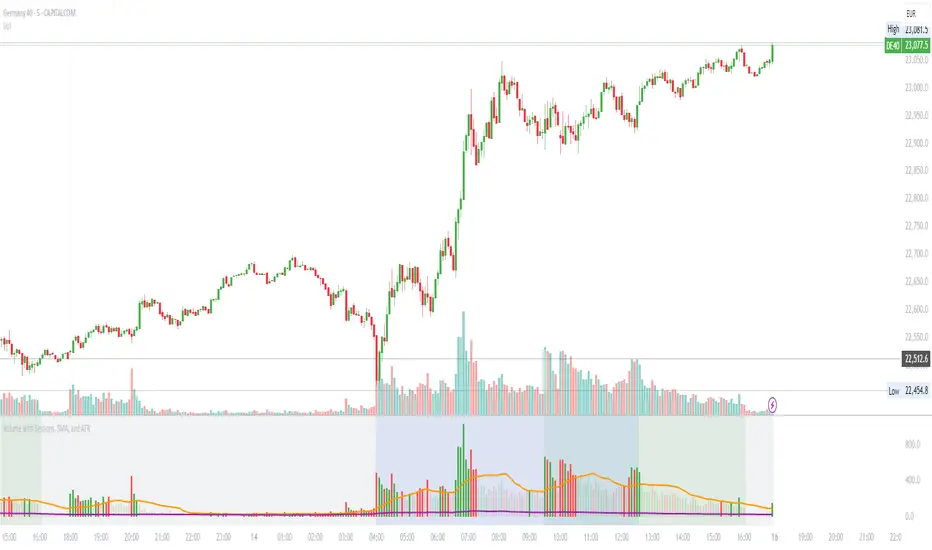
Volume with Sessions, SMA, and ATR Pine Script creates a custom volume indicator with several features, including:
SMA of Volume: It calculates the simple moving average (SMA) of the volume, which helps identify trends and determine if the current volume is above or below the average.
ATR (Average True Range): It calculates the ATR, which measures market volatility over a defined period.
Bullish/Bearish Volume Coloring: The script colors the volume bars depending on whether the price is moving up (bullish) or down (bearish), and whether the volume is above or below the SMA of volume.
Session Highlighting: It defines two major trading sessions:
NYSE (New York Stock Exchange) session from 9:30 AM to 4:00 PM Eastern Time.
LSE (London Stock Exchange) session from 8:00 AM to 4:30 PM GMT. These sessions are highlighted with background colors for easy identification.
Plotting: The volume is plotted as a histogram with varying colors depending on price movement and volume relative to its SMA. The ATR is also plotted as a purple line, and the SMA of volume is displayed as an orange line.
Background Colors: Background colors are applied during the NYSE and LSE sessions to visually differentiate between these trading periods.
Here's a breakdown of each section:
Key Inputs:
smaLength and atrLength: User-defined values for the lengths of the SMA and ATR calculations.
Main Calculations:
smaVolume: The SMA of the volume over the user-defined length (smaLength).
atrValue: The Average True Range over the user-defined length (atrLength).
Color Logic for Volume Bars:
If the current close is higher than the previous close, the volume is considered bullish, and the bar is colored green. If the volume is above the SMA, it’s a darker green; otherwise, it’s a lighter shade.
If the current close is lower than the previous close, the volume is considered bearish, and the bar is colored red. If the volume is above the SMA, it’s a darker red; otherwise, it’s a lighter red.
Plotting:
The script plots the volume as a histogram with dynamic coloring.
The SMA of the volume is plotted as a line.
ATR is plotted as a purple line for reference.
Background Color Highlighting:
The background is colored green during the NYSE session and blue during the LSE session.
Volume Delta with PVSRAVolume Delta with PVSRA
Volume Delta with PVSRA is an advanced volume indicator that dissects each bar’s volume into its directional components using higher resolution data. It visually distinguishes between buying and selling volume, so that for a bullish candle the bottom portion represents buying volume and for a bearish candle it represents selling volume. A dot is plotted at the 50% mark of the candle’s total volume, serving as a clear reference point.
Key Features:
Directional Volume Breakdown:
The indicator calculates the delta volume by analyzing lower timeframe data. The bottom portion of a bullish candle (displayed in green) represents buying volume, while that of a bearish candle (displayed in red) represents selling volume.
PVSRA Analysis:
Using Price-Volume Spread Range Analysis, the indicator compares the current volume to the 10-bar average. When volume is significantly higher (using thresholds of 150% and 200%), the candle borders are highlighted in custom colors, indicating medium or strong volume conditions.
Volume Moving Averages:
Three moving averages are plotted:
Total Volume MA (yellow): Tracks overall volume.
Buying Volume MA (green) and Selling Volume MA (red): These are re-centered around the total volume MA. A crossover of the green over the red typically signals rising buying pressure, while the opposite indicates increasing selling pressure.
Scalable Volume Bars:
The indicator scales the volume bars to provide optimal visualization on your chart.
Setup Instructions:
For best results, open your chart settings, navigate to the Canvas tab, and set the bottom margin to 0%. This ensures the indicator displays like a standard volume indicator without any unwanted gaps at the bottom.
Customize the various settings—including colors, border opacity, and moving average parameters—to suit your trading style.

Expanding Volume Range with Anchored VWAPExpanding Volume Range with Anchored VWAP Indicator Summary
This Pine Script indicator is designed for intraday trading, particularly for timeframes of 60 minutes or less. It combines several technical analysis concepts to provide traders with a comprehensive view of price action, volume, and potential support/resistance levels.
## Key Features
1. **Anchored VWAP (Volume Weighted Average Price)**
- Calculates and displays an Anchored VWAP line
- Resets at the start of each new day or when a new highest volume bar is detected
2. **Expanding Volume Range (EVR)**
- Identifies and highlights high volume bars
- Creates a box around the price range of the last three high volume bars
- Generates additional support/resistance lines based on this range
3. **Custom Multiplier Calculations**
- Allows users to customize the calculation of support/resistance levels
- Includes options for separate top and bottom multipliers
- Provides an exponential adjustment for fine-tuning
4. **Volume-Based Candle Coloring**
- Colors candles differently based on their volume relative to recent history
- Highlights the first candle of each session in a distinct color
5. **VWAP-Based Line and Fill Colors**
- Changes colors of lines and fills based on price position relative to VWAP
6. **Alert Generation**
- Creates alerts when price breaks above or below the EVR high and low levels
## User Inputs
The indicator offers several customizable inputs grouped into categories:
1. **Volume Colors**
- Customize colors for various elements (lines, fills, candles) based on volume and VWAP relationship
2. **Target Levels**
- Set multipliers for calculating target levels
3. **Multiplier Calculations**
- Enable/disable custom multiplier calculations
- Set base multipliers and exponents for top and bottom levels
## Functionality Breakdown
1. The indicator tracks the highest volume bars for the current and previous day.
2. It creates an Expanding Volume Range (EVR) based on the last three high volume bars.
3. Using the EVR, it calculates and draws support and resistance levels.
4. The levels can be calculated using either simple multipliers or a more complex exponential formula, depending on user preference.
5. Candles are colored based on their volume and whether they're the first candle of a session.
6. An Anchored VWAP is calculated and displayed, resetting at the start of each day or on new highest volume bars.
7. Alerts are generated when price moves beyond the EVR high or low levels.
## Use Cases
This indicator can be particularly useful for:
- Identifying potential support and resistance levels based on high volume price action
- Spotting changes in volume patterns throughout the trading session
- Recognizing price action relative to the Anchored VWAP
- Setting up potential entry and exit points based on the expanding volume range
Traders should use this indicator in conjunction with other forms of analysis and risk management strategies for best results.

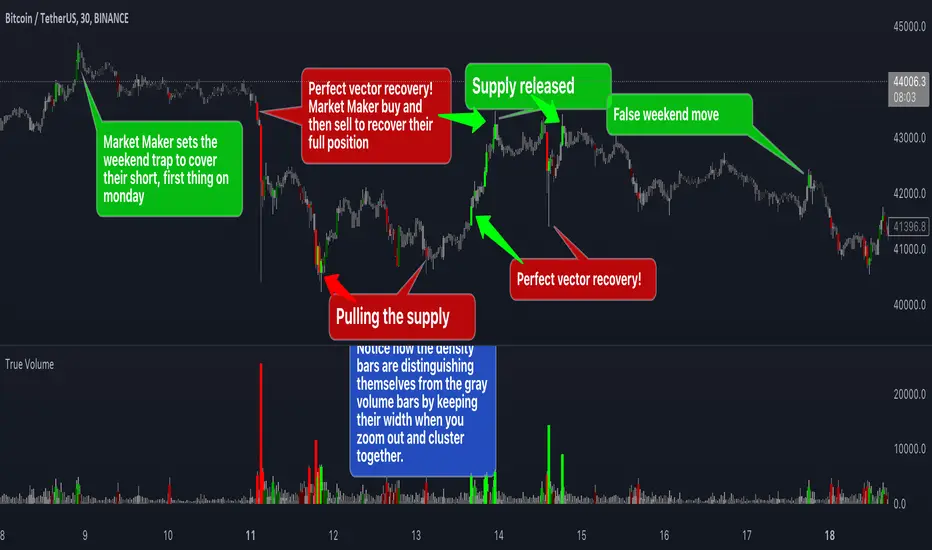
True VolumeThis indicator is designed to provide in-depth analysis of volume data from multiple sources and distinguish highly liquid candles by measuring the density of the volume. By focusing on the density and concentration of volume, rather than just the volume itself, it offers a more nuanced view of the market. This can be particularly beneficial in markets like cryptocurrencies, where understanding the role of market makers versus retail traders is crucial for strategic trading.
This is how it works:
Multiple Asset Integration:
Unlike standard volume indicators, True Volume allows the inclusion of up to four different assets (or the same asset from various exchanges) into its volume calculations. This feature provides a broader and more accurate total volume representation, essential in markets like cryptocurrencies where volume is dispersed across multiple exchanges.
Adjustable Time Anchors:
It offers various time anchor options, allowing traders to analyze volume data over different time periods or a specific amount of lookback candles. This flexibility helps in understanding volume trends over both short and long-term time frames.
Volume Density Analysis:
The core of this indicator is the innovative concept of Volume Density. It's calculated using a sigmoid function that normalizes the volume-to-price movement ratio in a unique way without needing a max cap or having the density column spike off the chart. This method helps in distinguishing between normal volume fluctuations and those that are unusually dense for the given price movement. This distinction is key in identifying potential market maker activities.
The Visuals:
The Volume Density is displayed in a unique way without compromising the original volume bars or cap the density. Infinite density can essentially be represented without having an infinitely large bar or caping out the density data. There's also two different color themes, optional bar color, and an option to flip the density bars up-side down for a different representation. Each of the original volume sources can be displayed separately as well. All colors as customizable as well for your own preference.
Price Volume Trend (PVT):
Included in this indicator is also the Price Volume Trend, which cumulatively measures the density delta, offering insights into the longer-term momentum of the market.
How do I trade it?
This indicator aims to give you insight into 'the other side of the trade', the Market Makers. When you buy, they provide liquidity by selling to you. That drives the Volume Density up.
Consider whether the market maker is currently long or short and might need to cover their position by wicking price back, or "adjust inventory". Especially towards the end of a market session.
Consider dense candles during market gaps or weekends to be market manipulation moves.
The density also goes up when stop losses are hit. If price makes a higher high or lower low, high density could indicate a liquidation event.
Pivot Boss - Advanced Volume IndicatorThis indicator measures "Compression and Expansion" of current bars volume against 10 day average volume(Can be user defined)
Avg Volume = 10 day avg volume
Wide volume = AvgVolume x 1.25 (Volume bar will be Blue color)
Narrow Volume = AvgVolume x 0.65 (Volume bar will be Magenta color)
Yellow line -- 5 bar avg volume
White Line -- 10 bar avg volume

Volume+ by BDthis is a simple volume indicator,
shows volume sizes with color differences on histogram (total volume, neutral volume and effective volume)
bar length = total volume, gray bar= neutral volume, green bar= pozitive volume, red bar= negative volume
variable value; The bar's average will be calculated until the given value. by default is average not calculated
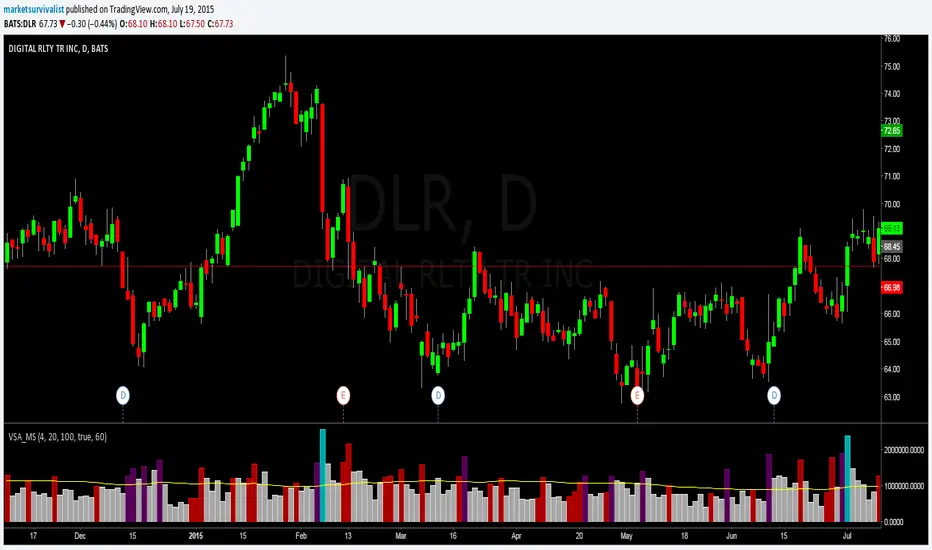
Volume Spike Analysis [marketsurvivalist]This indicator is based on the ideas about Volume Spike Analysis written about by Vincent Kott in his book Volume Spike Analysis. Formulas are presented in the book for another platform, but I wrote the script based on the charts he provided.
The indicator basically takes out the noise and colors bars based on factors of time and volume for day. There are three different time periods you can set: Short, Medium, Long. Each period can be set with a different color. The period value looks for highest volume bar within that period. If today's volume bar is the hightest value, it colors the volume bar based on the formatted color. It does not matter if the price bar is up or down. The defaults are 4 days, 20 days, 100 days. There is also a volume moving average available to show or hide based on you trading style.
The purpose is to easily see changes in volume. Typically, you would like to see volume rising as a new trend begins. This will show up quickly as you will see a cluster of rising red and / or purple bars.
Artharjan High Volume Zones v2Artharjan High Volume Zones (AHVZ)
The Artharjan High Volume Zones (AHVZ) indicator is designed to identify, highlight, and track price zones formed during exceptionally high-volume bars. These levels often act as critical support and resistance zones, revealing where institutions or large players have shown significant interest.
By combining both short-term (ST) and long-term (LT) high-volume zones, the tool enables traders to align intraday activity with broader market structures.
Core Purpose
Markets often leave behind footprints in the form of high-volume bars. The AHVZ indicator captures these footprints and projects their influence forward, allowing traders to spot zones of liquidity, accumulation, or distribution where future price reactions are likely.
Key Features
🔹 Short-Term High Volume Zones (ST-ZoI)
Identifies the highest-volume bar within a short-term lookback period (default: 22 bars).
Draws and maintains:
Upper & Lower Bounds of the high-volume candle.
Midpoint Line (M-P) as the zone’s equilibrium.
Buffer Zones above and below for intraday flexibility (percentage-based).
Highlights these zones visually for quick intraday decision-making.
🔹 Long-Term High Volume Zones (LT-ZoI)
Scans for the highest-volume bar in a long-term lookback period (default: 252 bars).
Similar plotting structure as ST-ZoI: Upper, Lower, Midpoint, and Buffers.
Useful for identifying institutional footprints and multi-week/month accumulation zones.
🔹 Dynamic Buffering
Daily/Weekly/Monthly charts: Adds a fixed percentage buffer above and below high-volume zones.
Intraday charts: Uses price-range based buffers, scaling zones more adaptively to volatility.
🔹 Visual Customization
Independent color settings for ST and LT zones, mid-range lines, and buffers.
Adjustable plot thickness for clarity across different chart styles.
How It Helps
Intraday Traders
Use ST zones to pinpoint short-term supply/demand clusters.
Trade rejections or breakouts near these high-volume footprints.
Swing/Positional Traders
Align entries with LT zones to stay on the side of institutional flows.
Spot areas where price may stall, reverse, or consolidate.
General Market Structure Analysis
Understand where volume-backed conviction exists in the chart.
Avoid trading into hidden walls of liquidity by recognizing prior high-volume zones.
Closing Note
The Artharjan High Volume Zones indicator acts as a volume map of the market, giving traders a deeper sense of where meaningful battles between buyers and sellers took place. By combining short-term noise filtering with long-term structural awareness, it empowers traders to make more informed, disciplined decisions.
With Thanks,
Rrahul Desai @Artharjan

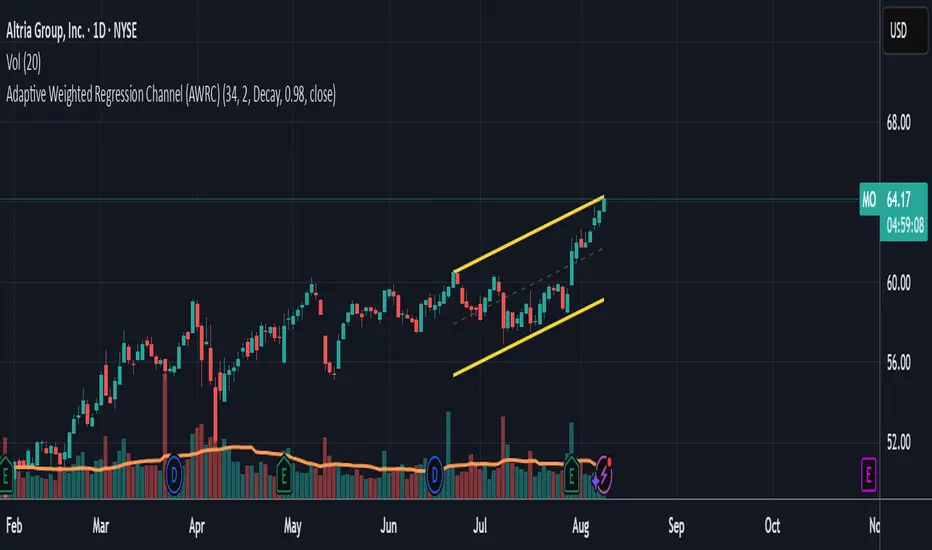
Adaptive Weighted Regression Channel (AWRC)Short Description:
The Adaptive Weighted Regression Channel (AWRC) is an advanced technical analysis tool that plots a dynamic regression channel based on the recent price action. The centerline is a linear regression (trendline) fitted to the selected price source over a rolling window. The channel boundaries are placed above and below the regression line by a user-selected multiple of the weighted standard deviation.
What makes AWRC unique is its ability to optionally weight each bar’s importance in the regression using Volume, ATR (Average True Range), or Recency Decay, offering a channel that can adapt to market volatility, participation, or trend acceleration.
Parameter Explanations:
length: Number of bars for the regression window (how many recent candles are included). Higher values = smoother, less sensitive channel.
StdDev Multiplier (mult): Controls the channel width. 2.0 is classic; higher = wider channels, lower = tighter.
Enable Weighting?: Turn ON to activate weighting of each bar. If OFF, all bars are equally weighted (classic regression channel).
Weight Type: Select what to use for weights (only active if Enable Weighting is ON):
"Volume": Higher volume bars have more influence on the regression.
"ATR": Bars with higher volatility (as measured by ATR) have more influence.
"Decay": More recent bars are given more weight (controlled by Decay parameter).
Decay: If Weight Type is "Decay", this controls the rate of recency decay. (e.g. 0.98 = slow decay; 0.90 = fast decay; values close to 1 mean a longer memory.)
Source for the calculation (src): Selects which price is regressed. Default is hl2 (average of high and low); you can choose close, open, etc.
Recommended Parameters:
For general use: length = 34, mult = 2.0, Enable Weighting = OFF, src = hl2
For volume-aware channel: Enable Weighting = ON, Weight Type = "Volume"
For volatility sensitivity: Enable Weighting = ON, Weight Type = "ATR"
For extra focus on recent price: Enable Weighting = ON, Weight Type = "Decay", Decay = 0.95 or 0.98
For swing trading: length = 21–55, mult = 1.5–2.5
For intraday/scalping: length = 10–20, mult = 1.0–1.5
Usage Tips:
The regression line shows the "best fit" trend for the selected window.
The channel captures the typical range; price breaking outside the channel can signal strength, exhaustion, or breakout.
Volume and ATR weighting help the channel adapt to market participation or volatility spikes.
Decay weighting locks onto the most recent trend direction quickly.
Adjust parameters to fit your timeframe and market volatility.
Use AWRC to spot trending moves, reversals, or overextensions.
Try different weighting and channel settings to match your trading style!
Volume with High/Low ColoringThe "Volume with High/Low Coloring" indicator is designed to help traders visually differentiate between high, low, and normal volume bars relative to recent historical averages. By applying dynamic color coding and customizable thresholds, this indicator enhances volume analysis and improves your ability to spot key moments of accumulation, distribution, or market inactivity.
High Volume: A bar is marked as high volume when it exceeds the average by a customizable multiplier (default is 1.5×) .
Low Volume: A bar is considered low volume when it falls below the average by another multiplier (default is 0.5×) .
Normal Volume: All bars that fall between the high and low thresholds.
Each category is displayed in a different user-selectable color, providing instant visual feedback for volume dynamics.
Customizable Colors:
High Volume: Light Green (default: semi-transparent green)
Low Volume: Light Blue (default: semi-transparent blue)
Normal Volume: Yellow (default: semi-transparent yellow)
Average Volume Line: Gray (optional reference line)
Volume with EMA and Coloring RulesSummary
This indicator plots the market’s volume as a histogram in a separate panel (not overlaid on the main price chart). An EMA (Exponential Moving Average) is then calculated based on the volume. The color of each volume bar switches dynamically:
• Blue when the bar’s volume is higher than the EMA
• White when the bar’s volume is lower than or equal to the EMA
This simple visual cue allows you to quickly see if the market’s current volume is above or below its average trend.
How to Use
1. Add to Chart
Apply the indicator to your TradingView chart, and it will open in a separate panel beneath the price.
2. Adjust EMA Length
Modify the “EMA Length” to control how quickly the average volume adapts to changes.
3. Interpretation
• Blue bars may indicate stronger-than-usual participation.
• White bars indicate volume is relatively lower compared to its recent average.
This indicator provides an at-a-glance way to see if trading activity is intensifying or easing, which can be paired with other technical or fundamental tools to help confirm market shifts or potential opportunities.

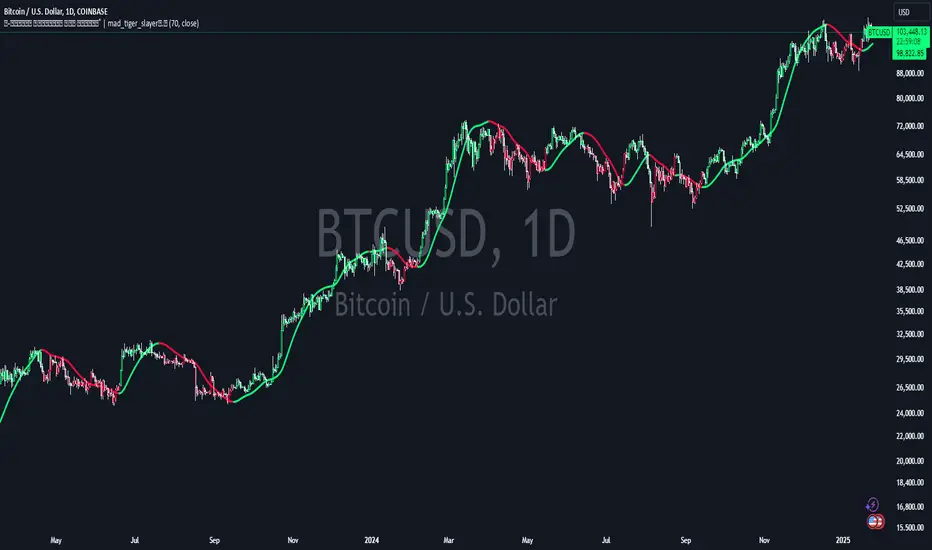
Volume Weighted HMA Index | mad_tiger_slayerTitle: 🍉 Volume Weighted HMA Index | mad_tiger_slayer 🐯
Description:
The Volume Weighted HMA Index is a cutting-edge indicator designed to enhance the accuracy and responsiveness of trading signals by combining the power of volume with the Hull Moving Average (HMA). This indicator adjusts the HMA based on volume-weighted price changes, providing faster and more reliable entry and exit signals while reducing the likelihood of false signals.
Intended and Best Uses:
Used for Strategy Creation:
Extremely Quick Entries and Exits
Intended for Higher timeframe however can be used for scalping paired with additional scripts.
Can be paired to create profitable strategies
TREND FOLLOWING NOT MEAN REVERTING!!!!
[Key Features:
Volume Integration: Dynamically adjusts the HMA using volume data to prioritize higher-volume bars, ensuring that market activity plays a crucial role in signal generation.
Enhanced Signal Clarity: The indicator calculates precise long and short signals by detecting volume-weighted HMA crossovers.
Bar Coloring: Visually differentiate bullish and bearish conditions with customizable bar colors, making trends easier to identify.
Custom Signal Plotting: Optional long and short signal markers for a clear visual representation of potential trade opportunities.
Highly Configurable: Adjust parameters such as volume length and calculation source to tailor the indicator to your trading preferences and strategy.
How It Works:
Volume Weighting: The indicator calculates the HMA using a volume-weighted price change, amplifying the influence of high-volume periods on the moving average.
Trend Identification: Crossovers of the volume-weighted HMA with zero determine trend direction, where:
A bullish crossover signals a long condition.
A bearish crossunder signals a short condition.
Visual Feedback: Bar colors and optional signal markers provide real-time insights into trend direction and trading signals.
Use Cases:
Trend Following: Quickly identify emerging trends with volume-accelerated HMA calculations.
Trade Confirmation: Use the indicator to confirm the strength and validity of your trade setups.
Custom Signal Integration: Combine this indicator with your existing strategies to refine entries and exits.
Notes:
Ensure that your trading instrument provides volume data for accurate calculations. If no volume is available, the script will notify you.
This script works best when combined with other indicators or trading frameworks for a comprehensive market view.
Inspired by the community and designed for traders looking to stay ahead of the curve, the Volume Weighted HMA Index is a versatile tool for traders of all levels.
Auto-magnifier / quantifytools- Overview
Auto-magnifier shows a lower timeframe view of candles and volume bars inside any main timeframe candle by zooming into it. Candles and volume bars as they develop are shown chronologically from left to right. By default, magnifier is triggered when less than 3 candles are visible on the chart.
By default, 20 lower timeframe candles are displayed by splitting main timeframe into 20 parts. The amount of candles displayed is a target rate, meaning the script will use a lower timeframe that has the closest match to 20 candles and therefore will vary a bit. Users can override automatic timeframe calculation and opt in to display any specific lower timeframe or adjust amount of candles shown (e.g. 20 -> 30 candles) per each main timeframe candle.
Example
Main timeframe set to 30 minute, candles displayed set to 20 -> Magnifying using 2 minute candles (30 minute/20 candles = 1.5 min, rounded to 2 min)
Main timeframe set to 30 minute, override set to 5 minutes -> Displaying 5 minute candles
Size of volume bars is calculated using relative volume (volume relative to volume SMA20), lowest bar representing relative volume values of under or equal to 1x the moving average and from there onwards progressively growing.
- Limitations and considerations
Amount of candles shown might flow over from the background on smaller screen sizes, in which case you would want to decrease the amount shown. Opposite is true for bigger screens, this value can be increased as more candles fit.
This indicator involves a lot of tricks with text elements to make it work automatically by zooming in. Size of wicks, bodies and volume bars are calculated by adding more text elements on big candles and less text elements on smaller candles. This means the displayed candles won't be a 100% match, but a rather a fair representation of the view, e.g. candle is green = lower timeframe candle is green, candle has a big wick = lower timeframe candle has a big wick (but not a 100% match).
Example
Magnified lower timeframe chart vs. Actual lower timeframe chart
Most mismatch will be found on the price levels where lower timeframe candles are shown, which is sacrificed for the sake of getting a better readability on the overall shape of lower timeframe price action. Users can alternatively optimize calculations for more accuracy, giving a better representation of the price levels where candles truly originated. This typically comes with the cost of worse readability however.
Example
Optimized for readability vs. Optimized for accuracy
- Visuals
All visual elements are fully customizable.

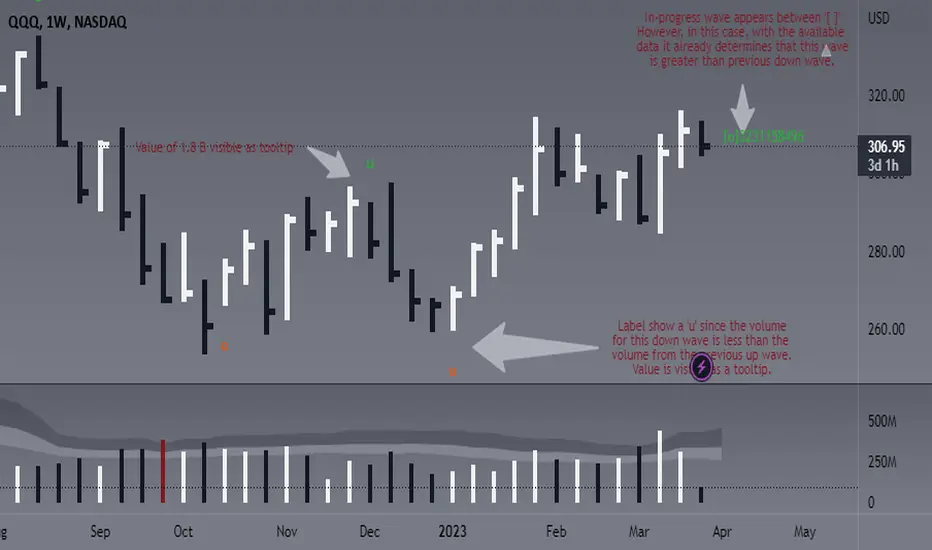
Weis Wave Volume - Simple labels and comparisonThis script is designed to identify and display the Weis Wave Volume on a chart. The Weis Wave Volume is a volume-based indicator that helps traders analyze market waves, identify trend reversals, and assess the strength of a trend. The script calculates wave volume based on user-defined input parameters, detects price waves, and displays the results as labels on the chart.
This version in particular is based on ideas from @the_MarketWhisperer and some other pieces of the script from @LucF.
The overall functionality of the script is to identify price waves and their corresponding volume. It does this by determining the trend direction and detecting trend reversals based on user-defined inputs such as the Trend reversal length and Price source for trend detection. The script also calculates and displays the cumulative volume of the current wave, the number of bars in the wave, the average volume in the wave, and consecutive increasing average volume bars in the same wave:
- An 'o' is printed to show that the volume of the current wave was 'O'ver/ above the count of the volume from preceding wave (regardless of it being up or down).
- An 'u' is printed to show that the volume of the current wave was 'U'nder/ below the count of the volume from preceding wave (regardless of it being up or down).
- Current wave will be between ' ' signaling that the wave is not confirmed yet.
- Actual values for the wave are available as tooltips. You decide how many bars to show the labels for, but for now and since I am a fan of clean charts, this is set to 50.
The user can adjust various inputs that affect the output of the script, such as Trend reversal length, Price source for trend detection, Labels for X last bars. Adjusting these inputs allows the trader to customize the script's behavior to better suit their trading style or specific market conditions. For example, by increasing the Trend reversal length, the script will require more consecutive bars in the opposite direction to confirm a trend reversal, potentially filtering out shorter-term price fluctuations. Similarly, adjusting the Price source for trend detection allows the user to base trend calculations on different price values, such as the high, low, or close of each bar.
In addition to the customizable inputs, the user can enable or disable the display of pivot markers and choose the colors for the up and down volume labels. This helps the trader to easily visualize and analyze the wave volume information on the chart.
In summary, this script offers traders a powerful tool for visualizing and analyzing the Weis Wave Volume on a chart. By identifying price waves, detecting trend reversals, and providing insights into the strength of a trend based on volume, the script can be a valuable addition to a trader's technical analysis toolbox. Please note this is not meant to provide any buy or sell signals, it should be rather used to complement your existing analysis.
Have fun and trade wisely ;)
Accumulation/Distribution VolumeThis is a simple yet powerful indicator that can replace volume, Money Flow, Chaikin Money Flow, Price Volume Trend (PVT), Accumulation/Distribution Line (ADL), On Balance Volume (OBV).
When "Baseline Chart" option is disabled, it looks similar to regular volume. The volume bars has two shades of green and red. The dark shade shows amount of accumulation and the light shade shows total volume (what you see on a regular volume indicator). Blue line is the moving average (or cumulative total) of A/D and the gray line is for total volume.
When money volume is enabled, volume it multiplied by price. As you can see in the chart below, trade volume in terms of USD was declining after ATH. This is not the case in regular volume chart which shows instrument volume (chart above).
In Baseline view, the aggregation method you choose can turn it into different indicators. With EMA/SMA aggregation, blue and gray line shows buy/sell pressure. At 0, there is not buy or sell pressure.
If you turn off volume bars (from style menu), it gives you a reliable indicator to measure divergence. This should be more reliable than most other range-bound indicators (i.e. RSI, MFI, CMF). I will publish a TA about correctly measuring divergence (it's a must read even if you are a pro trader). Make sure that the length is set to a large number on smaller TFs such as 4h.
For following results, set aggregation to cumulative and turn off money volume:
When wick weight=0, the GRAY line is identical to OBV indicator.
When normalized by spread and wick weight=10, the BLUE line is identical to ADL (improved by true range).
When normalized by previous bar price, wick weight=0, the BLUE line is identical to PVT.
How I use this indicator:
- Baseline chart, replaced my regular volume indicator
- Mostly 4h TF for divergence
- EMA aggregation (and occasional cumulative aggregation) with length above 50. I change the length to 100 and 200 for confirmation.
- Wick weight=0 or max 2.
With this indicator, you can learn how different indicators are built and how they are different from each other. I will publish a TA to explain more about different indicators and their pros and cons.
I will publish this indicator without volume bars and additional options to make it range bound.

Heikin Ashi VolumeHeikin Ashi candles decrease market noise so that broader trends can be more easily visualized. In a typical chart utilizing Heikin Ashi candles, volume bars are colored in such a way that they also allow for the visualization of trends during a bullish/bearish move.
The Heikin Ashi Volume indicator allows the trader to continue to use the same volume bar coloring technique to visualize trends without having to utilize the Heikin Ashi candles, since a Heikin Ashi candle’s OHLC values are not true prices but instead based on calculations in order to provide the ‘denoising’ effect they are known for.
In addition to providing the Heikin Ashi Volume coloring effects, the Heikin Ashi Volume indicator also allows the user to set a volume threshold level where the bar colors will be darker unless volume is beyond that threshold, helping traders quickly determine if there is enough participation in the market at that time to justify taking risk in a trade when the market isn’t very active. The user has the option to show or hide the threshold line, change the colors of the bullish/bearish colors (for both above and below threshold volumes) and the option for the indicator to gradually brighten the bar colors are they approach the threshold instead of having a clear line of demarcation showing volume above or below the set threshold.

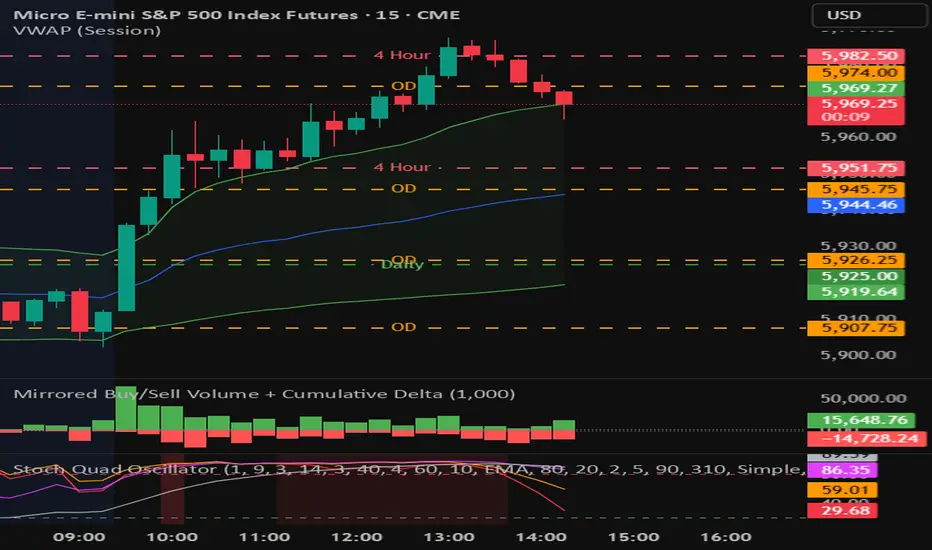
Mirrored Buy/Sell Volume + Cumulative DeltaUser Guide: Mirrored Buy/Sell Volume (Histogram)
🔍 What It Does
Displays green bars above zero for estimated buy volume
Displays red bars below zero for estimated sell volume
Adds a blue line showing Cumulative Delta (buy − sell over time)
Optional threshold lines help spot when net momentum builds up
📊 How Volume is Estimated
Same estimation method as the table version:
Buy Volume is proportion of volume estimated using (close - low) / (high - low)
Sell Volume is remainder of the total volume
Cumulative Delta = running total of (Buy − Sell) volume
This gives you:
A real-time sense of which side is gradually gaining control
More context than looking at candles or volume bars alone
✅ Best For
Visual trade decision support: who’s winning the tug-of-war?
Spotting trend initiation or momentum shifts
Combining with oscillator/trend tools for confirmation
⚠️ Limitations
Still an approximation — not based on actual trade aggressor data
Cannot separate passive vs. aggressive orders
Cumulative Delta does not reset unless specifically coded to do so
May mislead if the bar has long wicks or closes near midpoint
RVOL Effort Matrix💪🏻 RVOL Effort Matrix is a tiered volume framework that translates crowd participation into structure-aware visual zones. Rather than simply flagging spikes, it measures each bar’s volume as a ratio of its historical average and assigns to that effort dynamic tiers, creating a real-time map of conviction , exhaustion , and imbalance —before price even confirms.
⚖️ At its core, the tool builds a histogram of relative volume (RVOL). When enabled, a second layer overlays directional effort by estimating buy vs sell volume using candle body logic. If the candle closes higher, green (buy) volume dominates. If it closes lower, red (sell) volume leads. These components are stacked proportionally and inset beneath a colored cap line—a small but powerful layer that maintains visibility of the true effort tier even when split bars are active. The cap matches the original zone color, preserving context at all times.
Coloration communicates rhythm, tempo, and potential turning points:
• 🔴 = structurally weak effort, i.e. failed moves, fake-outs or trend exhaustion
• 🟡 = neutral volume, as seen in consolidations or pullbacks
• 🟢 = genuine commitment, good for continuation, breakout filters, or early rotation signals
• 🟣 = explosive volume signaling either climax or institutional entry—beware!
Background shading (optional) mirrors these zones across the pane for structural scanning at a glance. Volume bars can be toggled between full-stack mode or clean column view. Every layer is modular—built for composability with tools like ZVOL or OBVX Conviction Bias.
🧐 Ideal Use-Cases:
• 🕰 HTF bias anchoring → LTF execution
• 🧭 Identifying when structure is being driven by real crowd pressure
• 🚫 Fading green/fuchsia bars that fail to break structure
• ✅ Riding green/fuchsia follow-through in directional moves
🍷 Recommended Pairings:
• ZVOL for statistically significant volume anomaly detection
• OBVX Conviction Bias ↔️ for directional confirmation of effort zones
• SUPeR TReND 2.718 for structure-congruent entry filtering
• ATR Turbulence Ribbon to distinguish expansion pressure from churn
🥁 RVOL Effort Matrix is all about seeing—how much pressure is behind a move, whether that pressure is sustainable, and whether the crowd is aligned with price. It's volume, but readable. It’s structure, but dynamic. It’s the difference between obeying noise and trading to the beat of the market.

Modified Volume IndicatorThis indicator colors volume bars based on price and range conditions for a given period:
Green Bars:
The close is at least 70% of the way up the daily range (from the low).
The close is also 1% or more above the low.
Red Bars:
The close is at least 70% of the way down the daily range (from the high).
The close is also 1% or more below the high.
Gray Bars:
Volume bars that don’t meet the above conditions are neutral.
Purpose
Green Bars highlight strong upward closes.
Red Bars indicate weak downward closes.
Gray Bars show neutral or inconclusive price movement.
This indicator helps traders identify momentum shifts and trend strength in real-time.
RVOL + Volume Z-Score (Textbook)This indicator is a relative-volume and “volume anomaly” dashboard designed to help you quickly spot when a ticker is actually in-play versus simply drifting on normal activity. It plots standard volume bars (colored by up/down candles) and overlays multiple optional smoothers of volume (SMA, LSMA/linear-regression MA, HMA, ALMA) so you can see whether participation is expanding or fading across different smoothing styles. It also calculates RVOL (current bar volume divided by the average volume over a user-defined lookback) and displays RVOL (and Z) in a small table for quick reference.
The core feature is a textbook volume z-score: Z=(V−SMA(V,N))/StDev(V,N)
This measures how far the current bar’s volume is from its recent average in standard-deviation units, making it easy to filter for genuinely unusual volume. The script plots mean + 1σ and mean + 2σ threshold bands and can highlight “anomaly” volume bars when Z exceeds your chosen σ thresholds (default 1σ for broader detection, with alerts available for 1σ/2σ). Use it as a participation filter: combine high RVOL / high Z with your price structure (key levels, VWAP, trend) to validate breakouts or identify high-conviction reversal/flush events.

HVPro Style IndicatorHVPro Style Indicator – Historical Volatility + Volume
HVPro Style Indicator is a combined volatility-and-volume tool designed to help traders visualize market expansion and contraction phases.
It calculates Historical Volatility (HV) using log-returns and a customizable lookback period, then smooths the result for a cleaner trend signal.
The script also includes a volume histogram, scaled by a multiplier, with bar colors changing based on whether volatility is rising or falling.
This makes it easy to spot moments when both volume and volatility align, often signaling trend transitions, breakouts, or exhaustion.
Features
✔ Historical Volatility calculation (annualized)
✔ Smoothed HV for cleaner visual trends
✔ Volume histogram with customizable multiplier
✔ Volume bar color shifts based on HV direction
✔ User-controlled visibility for both HV and volume
✔ Lightweight and optimized for all timeframes
How to Use
Rising HV (green volume bars) can indicate trend expansion or breakout momentum.
Falling HV (red bars) suggests contraction, ranging conditions, or volatility cooldown.
Watch for volatility shifts combined with volume spikes for potential trade entries.

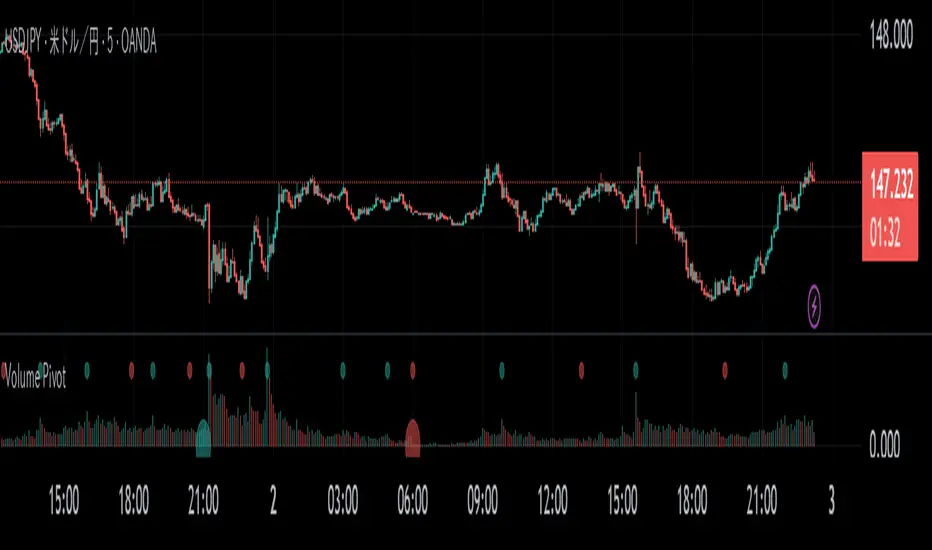
Volume PivotOVERVIEW
Volume Pivot is a technical analysis tool for TradingView designed to identify key turning points in the market by focusing on volume rather than price. It detects peaks and troughs (pivots) in trading volume to pinpoint moments of maximum market interest or exhaustion.
This indicator performs its analysis on both the Current Timeframe (CTF) and a user-defined Higher Timeframe (HTF). This dual-perspective approach allows traders to simultaneously grasp short-term market reactions and long-term structural shifts, leading to more informed and high-conviction trading decisions.
FEATURES
Automatic Pivot Detection
Automatically identifies and plots Volume Pivot Highs (peaks) and Pivot Lows (troughs) based on a user-defined Lookback Length.
Dual Timeframe Display
- CTF Signals : Plotted as tiny circles directly above the corresponding volume bars for immediate, short-term context.
- HTF Signals : Plotted as slightly larger circles at the bottom of the indicator pane, making them easy to distinguish as signals of higher significance.
Flexible HTF Configuration
Customize which higher timeframe to use for analysis based on your current chart timeframe. For example, you can set the indicator to reference the 1-hour chart as the HTF when you are on the 5-minute chart, and the Daily chart as the HTF when you are on the 1-hour chart.
Intuitive Volume Bars
The volume bars are color-coded to show whether volume is increasing (bullish color) or decreasing (bearish color) compared to the previous bar, offering a quick visual gauge of market momentum.
Full Customization
Easily toggle the visibility of CTF and HTF signals and customize the colors for bullish and bearish pivots to match your charting preferences.